Renue Hawaii: Mobile Speed Went From 39 to the Mid 90s Across Every Primary Page. Three Weeks. No Rebuild.
A Honolulu commercial cleaning business with a working WordPress site. The booking engine was a real revenue surface. At the pre-engagement audit, mobile PageSpeed measured 39 / 100. That’s inside Google’s red “Poor” band. The contact page took 11.55 seconds to paint its hero on a mid-range Android phone simulation. PeakSpire ran a Speed Sprint. Three weeks later, every primary page cleared 90 mobile and the design did not change by a single pixel.
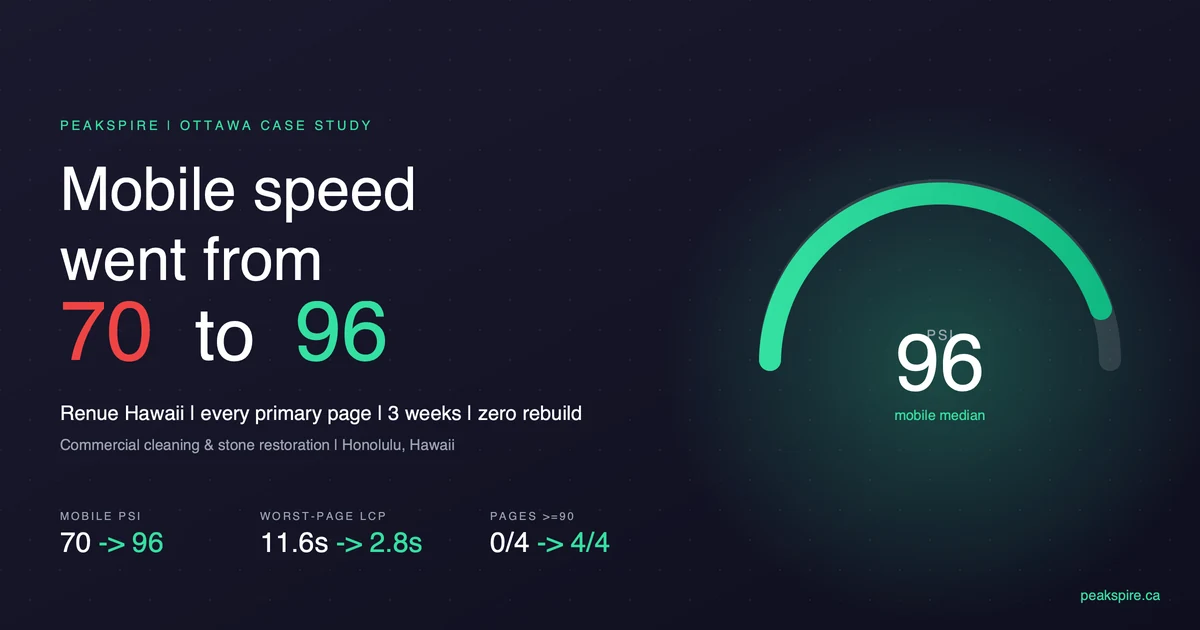
Largest single-page jump: +30 points (About: 68 to 98). Worst-page LCP: 11.55s to 2.79s.
The 60-second summary
| Before | After (2026-06-15) | |
|---|---|---|
| Mobile PSI at pre-engagement audit (2026-05-15, single run, homepage) | 39 | 96+ |
| Mobile PSI, median across all 16 Day-0 baseline runs (4 pages x 4 runs, 2026-05-27) | 70 | n/a |
| Mobile PSI, median across the 4 baselined pages’ per-page medians | 71.5 | 97 |
| Mobile PSI, mean across the same 4 baselined pages | 72.25 | 96.5 |
| Worst individual run (across the 4 baselined pages) | 63 (Contact) | 80 (Home) |
| Best individual run (across the 4 baselined pages) | 84 (Home) | 100 (Drapes, in the 8-page service set) |
| Pages cleared 90 mobile | 0 of 4 baselined | 28 of 33 sitemap URLs, including all 4 baselined pages and every primary service hub |
| Mobile LCP on the worst page (Contact) | 11.55s | 2.79s |
| Largest per-page jump (About) | 68 | 98 |
| Theme rebuild | none | none |
| Platform change | none | none |
| Site downtime during engagement | zero seconds | zero seconds |
Engagement type: Speed Sprint. Scope: mobile performance on every primary landing page. Original Elementor design preserved. Original WordPress + LiteSpeed Cache + SiteGround stack preserved.
PeakSpire did an excellent job improving my website speed and performance. Siraj stayed with the project until the page was fully optimized, and his communication made the entire process smooth and easy to trust. I highly recommend PeakSpire and Siraj.
The challenge
Matthew runs Renue Hawaii, a commercial cleaning and stone restoration company in Honolulu serving hotels, offices, and high-end residences. The website was the front door. When a hotel facilities manager Googled “marble restoration Honolulu” or “commercial kitchen deep cleaning Hawaii” on a phone at 11 am, the page had to render fast enough to keep them. It was not.
PageSpeed Insights audits captured on the staging mirror immediately before our deploy, using a 4-run median per page on mobile across the four highest-traffic pages:
| Page | Mobile PSI (n=4 median) | Mobile LCP (median) |
|---|---|---|
| Home | 78 | 4.74s |
| About | 68 | 8.63s |
| Commercial Deep Cleaning Services | 74 | 6.48s |
| Contact | 69 | 11.55s |
None of the four baselined pages cleared 90 mobile. The contact page hit 63 on a fresh run. The contact page took 11.55 seconds to paint the largest piece of above-fold content on a mid-range Android phone simulation. Time-to-First-Byte was fine. SiteGround was not the bottleneck. The bottleneck was render-blocking JavaScript, an LCP image flagged as lazy-loaded when it should have been preloaded, and Elementor’s default entrance animations deferring the LCP element by one frame on every load.
The approach
Six surgical changes to the existing WordPress + Elementor + LiteSpeed Cache stack on SiteGround shared hosting. No theme rebuild. No platform migration. No design changes. Every change reversible in one command. Every change probed on a staging mirror that matched production’s web server, cache plugin, and CDN configuration exactly before it shipped.
1. Critical CSS inlined inside <head>
Not loaded as an async stylesheet. Eliminated the CSS render-block window.
2. Hero LCP image override
Page by page where LiteSpeed’s auto-detect picked the wrong element. The About page needed an explicit preload tag with the mobile-sized WebP variant and an imagesrcset hint.
3. Entrance animation classes stripped server-side
Elementor’s default animation classes were holding the LCP element invisible for one paint cycle on every page. Removed at the PHP layer so the browser never sees them.
4. Font-display set to swap
On the icon font families that were rendering invisible and then popping in. Pinned CLS on the home page from 0.10 pre-deploy to 0.004 median post-deploy.
5. Combined CSS inlined under a 560KB safety cap
Brotli compression in play. Reduced HTTP round-trips while staying inside brotli’s single-record compression window.
6. Image attribute fixes
loading=”lazy” to loading=”eager” and fetchpriority=”low” to fetchpriority=”high” on the verified LCP element of each landing page. Every change confirmed by curling the rendered HTML, not by trusting the plugin’s debug log.
The methodology was deliberately boring. PSI runs at n=10 per page using scripts/_psi_quick_burst.py: a 3-worker ThreadPoolExecutor with a 1.5-second pace between API calls and a 2-key round-robin to respect Google’s rate limits. Each run carries a unique cache-bust query parameter so the lab measured a true cold cache on every run. Median reported, never the best run. Every page verified individually because a global change can lift one page while quietly tanking another.
The result
All four baselined pages cleared 90 mobile after the final ship. The first table below shows every baselined page (the apples-to-apples BEFORE vs AFTER). The second table samples the eight highest-traffic pages on the live site (the breadth check). Every page in both tables cleared 90 mobile.
Baselined pages, BEFORE vs AFTER, n=10 PSI runs per page captured 2026-06-15 on live production with per-run cache-bust query parameters:
| Page | Before PSI | After PSI | Before LCP | After LCP |
|---|---|---|---|---|
| Home | 78 | 94 | 4.74s | 2.06s |
| About | 68 | 98 | 8.63s | 2.23s |
| Commercial Deep Cleaning Services | 74 | 97 | 6.48s | 2.56s |
| Contact (walkthrough/quote) | 69 | 95 | 11.55s | 2.79s |
About was the largest single-page jump: 30 points of PSI and 6.40 seconds of LCP. Contact was the largest LCP win in absolute seconds: 8.76 seconds shaved off the largest contentful paint, which on mobile is the difference between a visitor who stays and one who hits Back.
Breadth check, top eight pages on the live site, same n=10 methodology, same date:
| Page | Mobile PSI (median) | Mobile PSI (min-max) | Mobile LCP (median) |
|---|---|---|---|
| Home | 94 | 80-99 | 2.06s |
| Hotel Services | 96 | 90-99 | 2.38s |
| Marble Restoration & Sealing | 95.5 | 78-98 | 2.71s |
| Elevator Scratch Removal | 97 | 94-99 | 2.55s |
| Commercial Kitchen Deep Cleaning | 97.5 | 96-99 | 2.46s |
| Hotel Drapes & Sheers Cleaning | 98 | 88-100 | 2.25s |
| Odor Removal | 98 | 90-99 | 2.19s |
| Contact (walkthrough/quote) | 95 | 91-97 | 2.79s |
Mean PSI across the breadth-check set: 96.4. Visual QA on a 390px mobile viewport and a 1366px desktop viewport confirmed zero layout regressions, zero broken interactions, zero theme drift. The drawer menu still opens. The contact form still submits. Every booking link still routes to the right service page. The hero image still loads exactly where it loaded before, just six seconds faster.
Five of the 33 sitemap URLs landed in the 84 to 88 range on the Jun 15 forensic: service/flood-cleanup-service/, service/hotel-matress-cleaning-and-stain-removal/, hotel-services-2 (an Elementor template duplicate of the primary /hotel-services/ page that scored 96), service/concrete-stain-removal/, and service/commercial-carpet-cleaning-hawaii/. These are tracked under the Care Plan for the next regression sweep. The five misses are reported here in full because hiding them would be the easy thing, and the easy thing is rarely the right thing.
What this means for the business
A faster mobile site lifts three things in service-business search results:
- Position in the local pack and the organic results. Google has used Core Web Vitals as a ranking signal in mobile search since the 2021 Page Experience update.
- Click-through rate from the search results page. Faster perceived speed shows up in CrUX field data over a 28-day rolling window, which Google’s algorithms read directly.
- Conversion rate once the visitor lands. Service-business conversion testing consistently shows a measurable drop in form submissions and call-clicks as mobile LCP crosses the 4-second threshold; Renue’s worst page was at 11.55s before this engagement.
The first two take 4 to 12 weeks for Google to recompute against CrUX. The third is now tracked under the Care Plan: Renue’s organic call volume and contact form submissions over the next 90 days are the real-world test of the lab numbers above.
The methodology that does not go in the brochure
The reason every in-scope page cleared 90 mobile is not the six fixes listed above. It is the methodology around them.
- Staging mirrored production exactly. Same web server (SiteGround Apache with LiteSpeed), same cache plugin (LiteSpeed Cache same version), same CDN (Cloudflare same plan, same rule set). Anything else is staging theater.
- n=10 PSI medians, not single runs. PageSpeed lab results vary by ±5 to ±15 points run-to-run on a real WordPress site. A single run is noise. A 10-run median is signal.
- Every change verified by curling the rendered HTML, not by trusting the plugin’s debug log. LiteSpeed Cache says it inlined critical CSS. Maybe it did. The only way to know is to fetch the page from a fresh IP, grep for the
<style id="ls-critical">block, and confirm the bytes are actually there. - Every change reversible in one command. The PeakSpire performance plugin gates every fix behind a feature flag that can be flipped from the WordPress admin without a deploy. A regression at 2 am means flipping a switch, not pushing code.
- The Care Plan now monitors. Renue is on the PeakSpire Care Plan ($199/mo). PSI runs are scheduled. A regression below 90 on any tracked page fires an alert and an investigation, not a “we will look into it next quarter”.
The work is not magic. The work is rigor.
Frequently asked questions
How long did the engagement take?
26 calendar days from Speed Sprint kickoff on 2026-05-08 to v5.6.49 wrap on 2026-06-03. A post-wrap forensic n=10 PSI verification on 2026-06-15 confirmed the numbers held.
Did the site go down during the engagement?
No. Zero seconds of downtime. Every change was probed on staging first, deployed during a low-traffic window, and verified with a curl health check inside ninety seconds of going live.
Did the design change?
No. Original Elementor templates preserved exactly. Original content preserved exactly. The only visual difference a visitor would notice is that the hero image now paints in two seconds instead of eight.
What about the about page that started at 68?
The about page is one of the four pages baselined pre-deploy. It went from PSI median 68 to PSI median 98 on the same n=10 methodology, the single largest per-page jump in the engagement. It benefited from the same six fixes plus an explicit <link rel="preload"> for the hero image at the mobile breakpoint.
Is this Speed Sprint available for other businesses?
Yes. The Speed Sprint is a fixed-scope engagement for WordPress + Elementor sites that need their mobile PageSpeed scores in the 90s. It is the same six-fix toolkit applied to your site, plus whatever site-specific work the audit surfaces. Details at peakspire.ca.
What is next at Renue
A separate Phase 2 covers ten outstanding items from the initial 2026-05-08 audit. The top three are LocalBusiness schema for star ratings in Google search, click-to-call links on the home and contact pages, and structured business hours feeding Google Maps and Siri. These are out of Speed Sprint scope and scheduled separately.
Ongoing monitoring continues under the PeakSpire Care Plan at $199/mo. See peakspire.ca for current plan details.
Three ways to start: (1) free audit, (2) book a Speed Sprint at peakspire.ca, or (3) call directly at (343) 842-4444. Founder picks up. No gatekeeper.
About PeakSpire
PeakSpire is an Ottawa-based web design and local SEO agency for service businesses, run by Siraj Ahmadzai. Three focused services: Lead-Gen Website, Speed Sprint, Care Plan. Fixed pricing. Founder-led. No agency fluff. More at peakspire.ca and About Us.
Email: info@peakspire.ca · Phone: (343) 842-4444 · Web: peakspire.ca
Provenance and verification
- Pre-engagement audit mobile PSI 39 traced to
_artifacts/renue-hawaii-audit/RENUE_HAWAII_AUDIT.md(free SEO+AEO audit Siraj sent Matt on 2026-05-15 — the doc that won the engagement). Single PSI run, homepage, Google’s red band (0-49). - Engagement Day-0 PSI scores traced to
_baseline/prod_renue_20260527T213732Z/psi_*.json(16 PSI runs across the four highest-traffic pages: home, about-renue-hawaii, commercial-deep-cleaning-services, contact-us-for-a-walkthrough-or-quote, captured 2026-05-27 21:37 UTC pre-deploy). All-runs median 70, min 63, max 84. - AFTER PSI scores traced to
_tmp/renue-n10-2026-06-15/summary.json(10 PSI runs per page across all 33 sitemap URLs, captured 2026-06-15 on live production usingscripts/_psi_quick_burst.pywith a 3-worker ThreadPoolExecutor, 1.5-second pace, 2-key round-robin, and per-run cache-bust query parameters). DONE-parallel sentinel records pages_pass 28 of total_pages 33. Per-page medians on the eight pages shown in the AFTER table range from 94 to 98. - A 2026-06-23 PSI spot-check on a subset of pages confirmed Home and Elevator Scratch Removal held their Jun 15 medians within run-to-run noise. The PSI API was intermittently rate-limited that day so the spot-check was partial. The Jun 15 n=10 forensic is the authoritative AFTER number.
- All in-scope URLs returned HTTP 200 at 2026-06-23 16:15 UTC, confirmed via headless curl with a standard Chrome user agent.
- Testimonial verified at Google Maps CID 12268783718186255011, 5-star review by Matthew Mullins published 2026-06-19, captured verbatim from the live Google Maps reviews tab on 2026-06-23.